There’s been a bit of a social-media back-and-forth between us and Jason Abaluck about the design and statistical significance of the Bangladesh Mask RCT. To focus and hone the discussion on some crucial details, we just posted a short note where we re-analyzed the data from this trial using standard non-parametric paired statistics tests on treatment-village pairs. In this blog, we summarize those results, highlighting potentially significant biases in the study. Importantly, we found that the behavior of unblinded staff when enrolling study participants was one of the most highly significant differences between treatment and control groups. The significant impacts on staff and participant behavior urge caution in interpreting small differences in the study outcomes which depended on survey responses.
Let’s first review the full study protocol, as it’s a cluster RCT and hence a bit more complicated than the typical trials with which many are familiar. First 600 villages in Bangladesh were paired based on COVID-case data, population density, and population size. Each paired village was assigned to treatment or control at random. Next, observers were sent to the treatment and control villages to enroll households in the study. Importantly, observers were not blinded to the treatment assignment in each village. The observers were also tasked with giving out the masks in the intervention villages, so they knew if the village was assigned to treatment or control. Households were approached by the observers and the households either (a) consented to participate, (b) declined to participate, or (c) were marked “unreachable” by the unblinded observers. The study team then proceeded to implement a mask promotion intervention in the treatment villages. In both villages, participants were asked to report COVID-like symptoms. Those who reported symptoms were asked to volunteer blood draws for serology. The primary endpoint was evaluated based on the number of these blood draws that tested positive for COVID antibodies.
As we have noted before, despite 300:300 randomization of the 600 villages, there was a notable imbalance in the size of the consenting populations between the control and treatment groups. The control group contained 156,938 individuals while the treatment group contained 170,497 individuals. The total absolute numbers of symptomatic seropositives in the treatment and control villages was 1086 and 1106, respectively. This difference is too small to be significant if participants had been individually randomized. In the study, an effect is asserted for the relative rate of symptomatic seropositives, i.e., normalized by population denominators. We note that the 10% decrease reported in the fraction of individuals who become symptomatic seropositives is not driven primarily by a decrease in the numerator of this fraction of symptomatic seropositives, but instead by the increase in the denominator.
What is the right way to test whether attributes differ between the treatment and control groups? If we have an attribute that we observe in every village, we can assess the hypothesis “a control village is equally likely to have a larger value of the attribute than its control pair than it is to have a smaller value.” Since the villages were paired, a standard non-parametric test for such questions is the Wilcoxon signed-rank test. This test is nice because we need not worry about using sophisticated models or variance correction techniques. Instead, we can just try to assess if bulk statistics are plausibly different in the treatment and control groups. Let’s use this test to gain insights about the mask study.
First, let’s look at the count in each village of individuals who reported COVID-19 symptoms and tested positive for covid-antibodies. The null hypothesis is that it is equally likely for a paired village to have more symptomatic seropositive in control as in treatment. According to the Wilcoxon signed rank test, the p-value is 0.97 and we cannot reject the null hypothesis. What about the rate of symptomatic seropositivity? Was the percentage of infections in the control group higher than in the treatment? Again, we cannot reject the null as the p-value of the Wilcoxon test is 0.25. In our writeup, we found similar results when restricting attention to subgroups assigned to cloth masks and surgical masks, and also in the population of individuals over 60. Based on these tests, we cannot assert that the intervention affected the primary endpoint of symptomatic seroprevalence. However, there are behavioral effects that are significantly different between treatment and control.
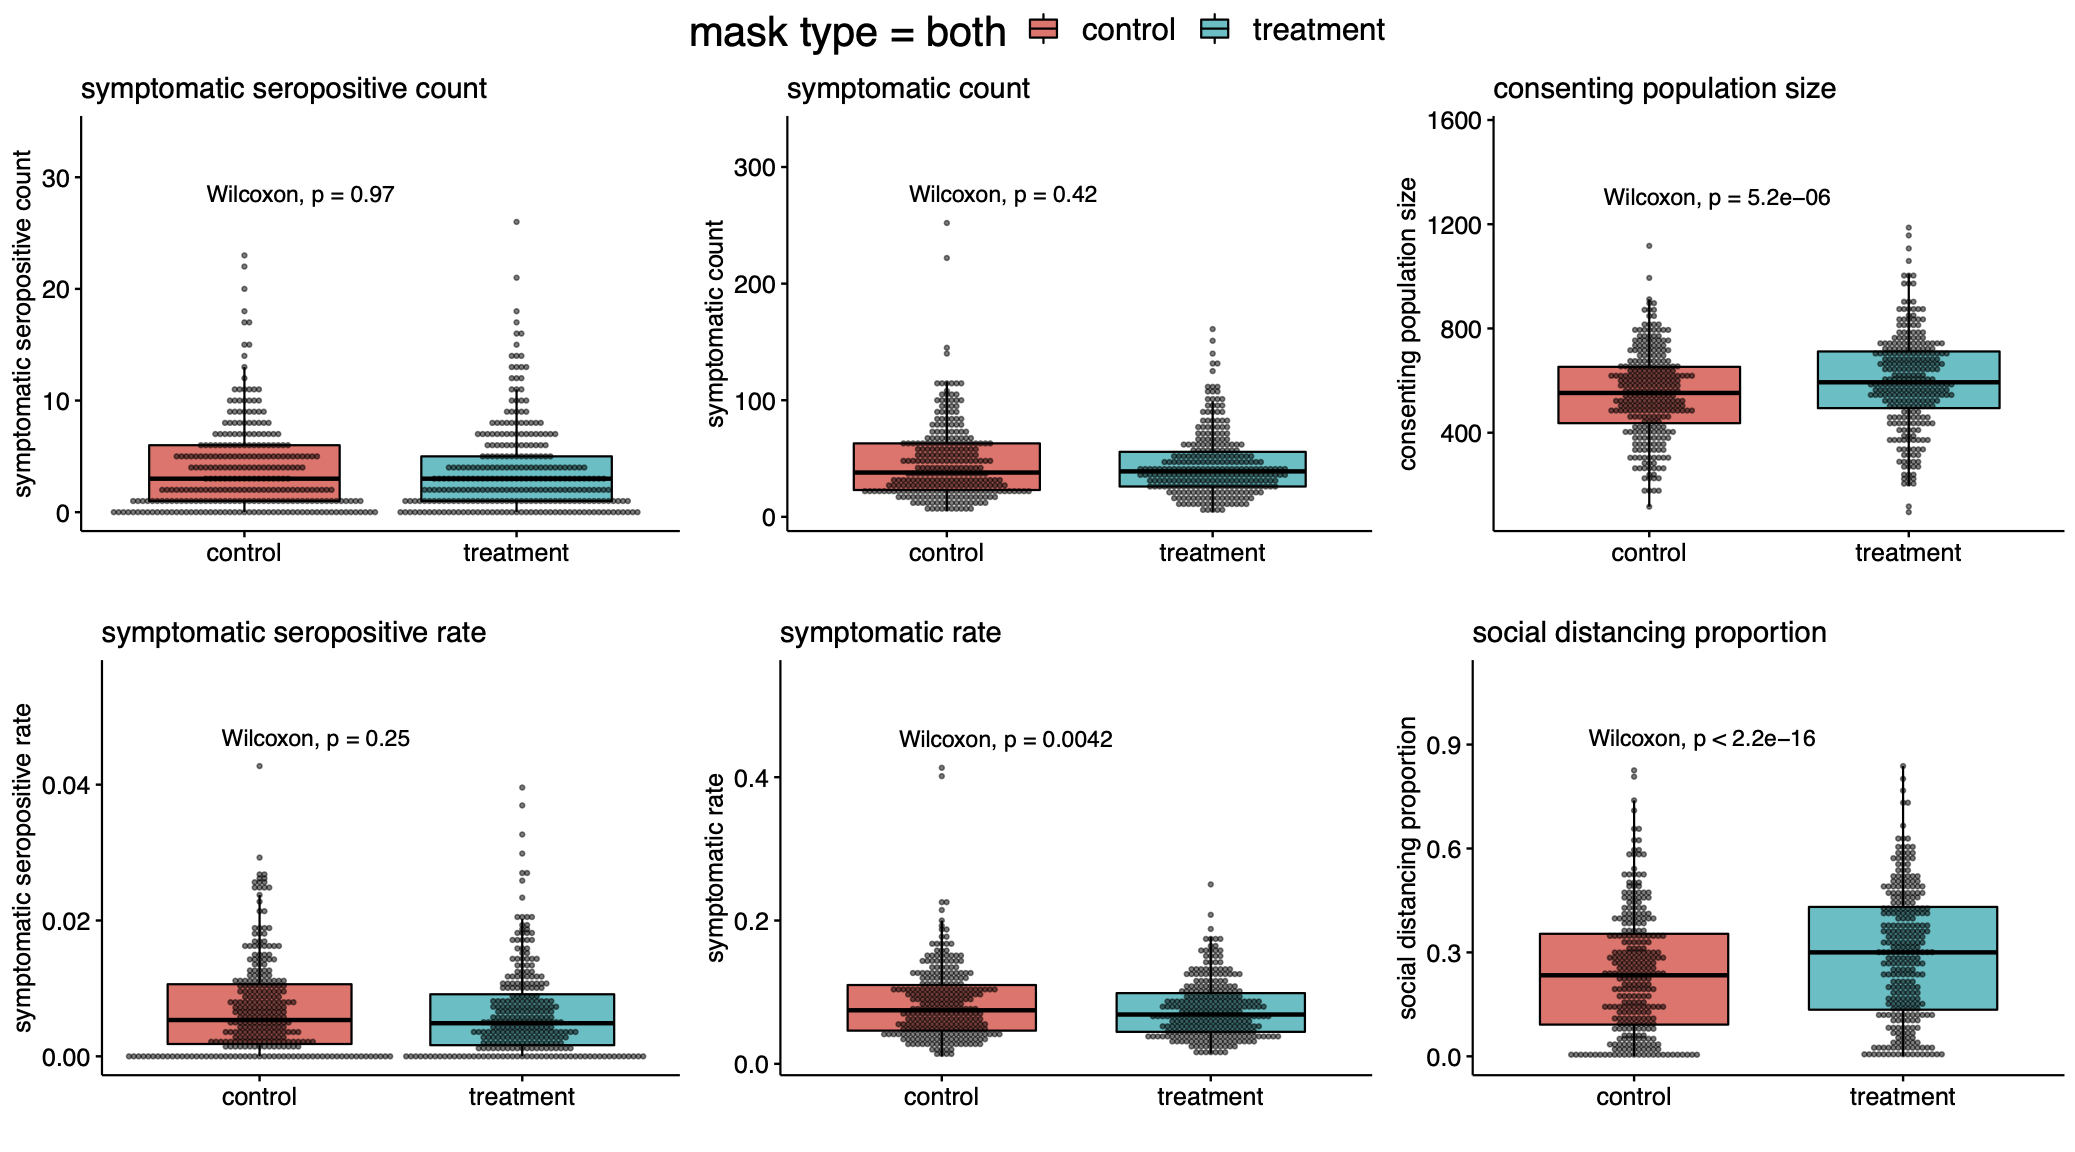
From our analysis, it is quite clear that more mask wearing was observed in the treatment group rather than the control group (p<$10^{-47}$). Moreover, there was a large difference in observed social distancing (p<$10^{-15}$). It is notable—even if one did not expect any effect from masks at all—that the increase in observed physical distancing did not translate to clearer differences in symptomatic seropositivity between treatment and control groups.
Second, the populations of the treatment and control groups themselves are very different. One of the main difficulties in running a mask trial is the issue of blinding. You certainly cannot run a blinded intervention as people know whether or not they are wearing masks. But in such unblinded studies, it is critical that the populations sampled to be surveyed are identical before the unblinding occurs.
Here is where things get a bit subtle. The villages were assigned to treatment at random, but the households were not. The surveyors who handed out masks knew in advance the treatment assignment of their villages. This knowledge alone induced a highly significant difference. The fraction of households approached in each village is significantly different in treatment and control (p<$10^{-11}$). This selection bias induced a large imbalance in the size of the treatment and control groups, and may have affected the overall seropositivity counts. Interestingly we found that the rate of consent for symptom surveys and the rate of consent for blood draws were indistinguishable between treatment and controls. The main significant difference was due to the behavior of the study staff.
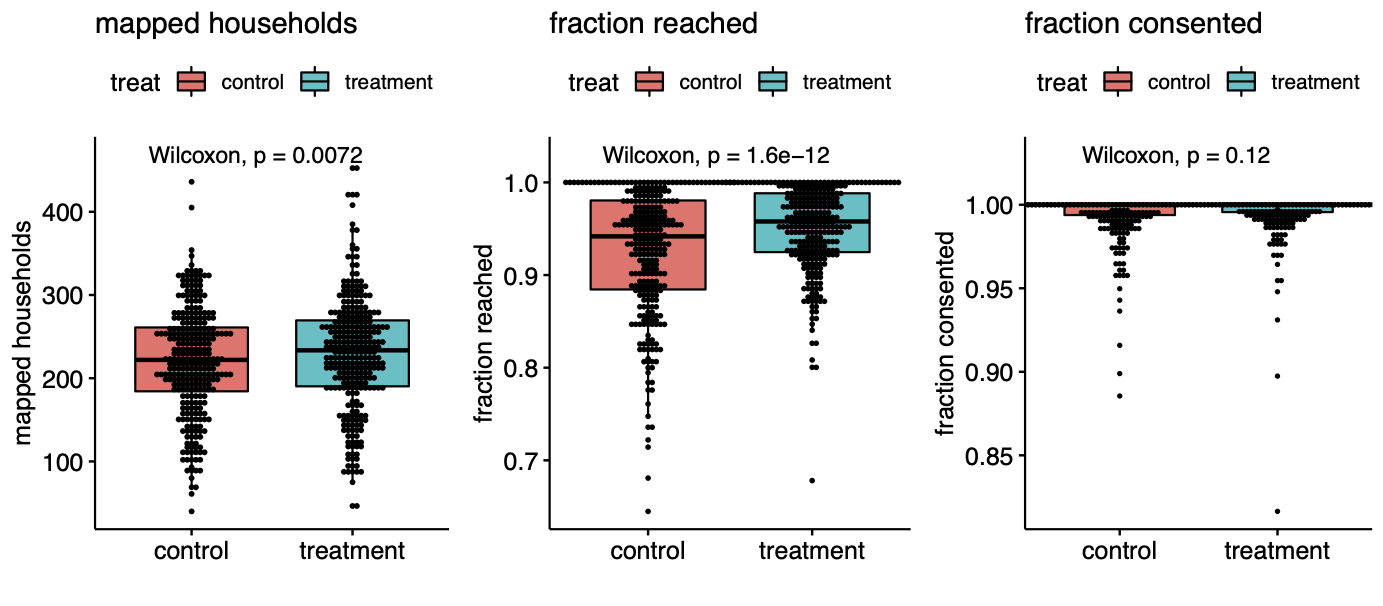
That the unblinded staff behaved differently in the different types of villages is not surprising and similar experimenter behavior has blemished randomized trials since their inception. We can’t know the exact cause of the difference in households reached, but perhaps the staff put just a little bit more effort into soliciting responses in the treatment group because they were excited about testing their intervention. Whatever the case, this behavioral difference created a large population difference between the groups: whereas 3,394 of 68,514 households were unreachable in the treatment group, 4,970 of 65,536 households were unreachable in control. This is a difference of over four thousand people, far exceeding the 20 case difference in symptomatic seropositivity.
Our analysis suggests that the impact of the mask intervention was highly effective at modifying behaviors (distancing, mask-wearing, symptom reporting), but that any effect on actual symptomatic seropositivity was much more subtle. In particular, whatever effects the intervention had on the rate of symptomatic seropositivity in the villages was certainly not large relative to other factors contributing to variance in this parameter across villages. We suggest that the very large causal effects on consent rates and thus population denominators urge caution in interpreting the small differences we see in symptomatic seropositivity between treatment and controls, which are not statistically significant according to standard nonparametric paired tests.
Code to reproduce the figures in this post and those in our technical note can be found here.