A recent Twitter quiz asked “what is a powerful concept from your field that, if more people understood it, their lives would be better?” Unambiguously, the answer from my field is statistical significance. Significance testing is a confusing, obscure statistical practice. It is hard to explain and usually impossible to justify. But papers can only be published if they are “statistically significant.” Here, I’ll explain in as plain terms as I can what statistical significance means in almost every published scientific study. I’ll do this without ever defining a p-value, as p-values have nothing to do with the way significance testing is used. Instead, significance testing amounts to hand wavy arguments about precision and variability. Laying it out this way shows why the authority granted to significance testing is so suspect and unearned.
Let’s suppose we’re trying to evaluate the benefit of some intervention. We test the intervention on a bunch of individuals and compute the average benefit which we call the effect size. The effect size could be the number of years of life a person gains with some cancer treatment or the amount of money gained with an investment strategy.
Since the effect size is the average of all the individuals in a study some individuals will have received less benefit than average and some more than average. Combining this varied benefit with the reality that experiments are always noisy and complicated, it may very well be that even if we measure a positive benefit on average, the intervention may actually be mostly harmful to the general population.
Think about the hypothetical situation where on half the population the benefit is equal to 1 and on the other half it’s negative 1. In this case, the average benefit is zero. If we collected a random set of people and computed the average effect size, we’d see a positive effect size about half of the time. In other words, if your experiment was “flip a coin ten times,” you’ll see 5 or more heads about half of the times you run this experiment.
The experimenter’s goal is to distinguish whether the benefit is large, small, or if the intervention is actually harmful. What the paradigm of statistical significance aims to do is to find a way to determine if an intervention is “mostly good.” It goes forth like this: using statistics, you estimate the standard error (SE) of the measured effect size. Roughly speaking, the standard error measures how spread out the effect size is over a population. When the standard error is small, everyone in the population experiences the same effect from a treatment. When the standard error is large, even if the effect size is positive, some may experience negative effects and some positive.
If the measured effect size is greater than twice the standard error, you declare that you have discovered your intervention is statistically significant at the “p<0.05” level. If the effect size is bigger than 2.6 times the standard error you declare statistical significance at the “p<0.01” level. If effect size is even bigger than three times the standard error you declare statistical significance at the “p<0.003” level! Wow! There’s a Nobel Prize in your future. But if the effect size is only 1.9 times bigger than the standard error, you unfortunately have not found a statistically significant result and have to throw all your work in the trash. Unless, of course, you are an economist. In this case, you are allowed the special “p<0.1” level, which occurs when the effect size is 1.7 times the standard error.
The following figure, adapted from a tweet by Thomas House, nicely illustrates the situation:
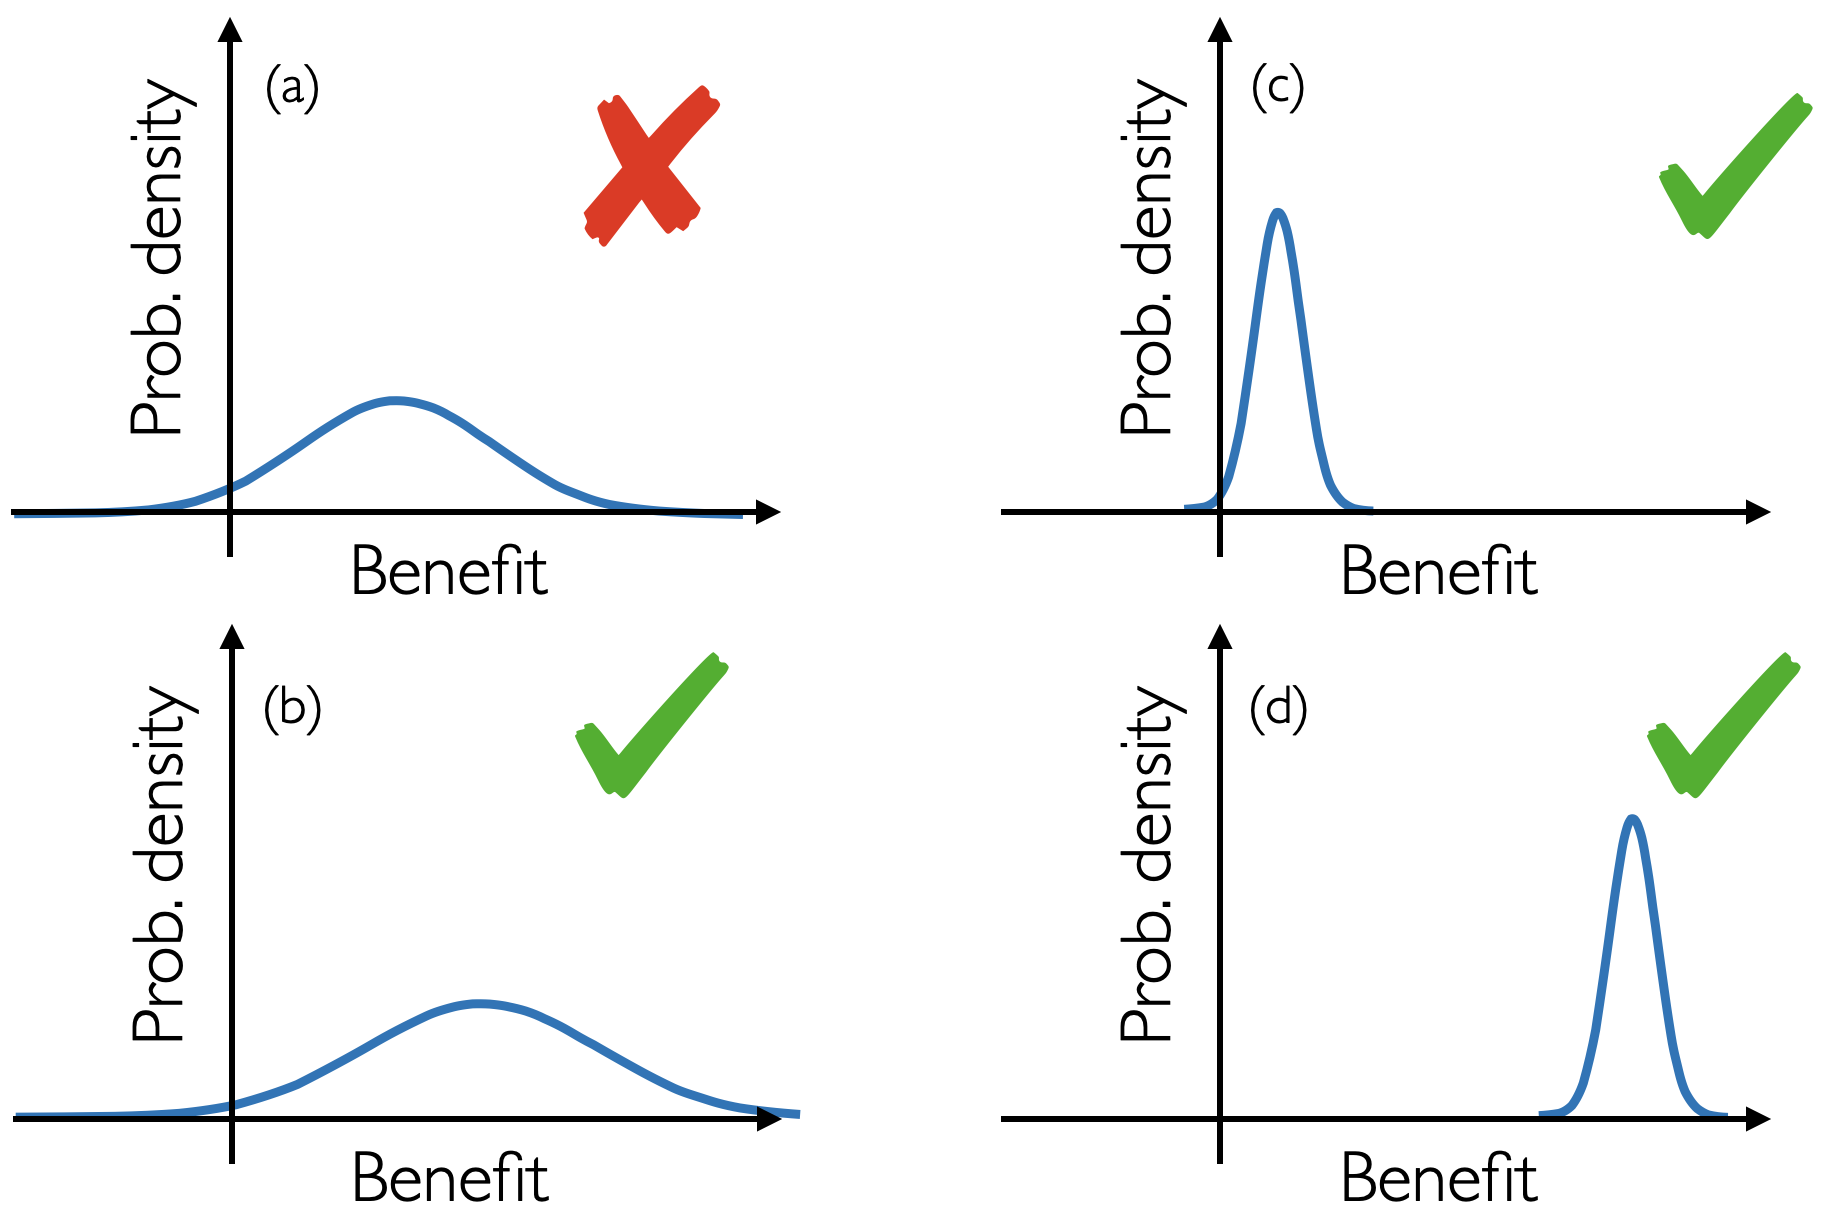
Here, there are four hypothetical distributions of benefit. All but (a) are “statistically significant.” The interventions we are always striving for are ones with clear benefit, like (d) in the bottom right. Interventions like this do exist: In the Pfizer trial, the effect size was 12 times larger than the standard error. Vaccines work! But most interventions are not vaccines (or parachutes for that matter).
The other panels show why statistical significance alone is so problematic. Figures (a) and (b) are nearly indistinguishable plots, but one is significant and the other is not. Moreover, statistical significance also misses the forest for the trees. You can have a miniscule effect size and still have a significant effect. Do we always prefer the (c) to the (a)? Is a meager, but mostly positive benefit necessarily better than a treatment potentially of large benefit to some but harmful to others necessarily? Wouldn’t it be in our interest to understand this spread of outcomes so we could isolate the group of individuals who benefit from the treatment?
The fact that a mere factor of 1.5 separates the difference between “not publishable” and “undoubtedly real” is deeply concerning. And every statistician knows how estimates of standard error can be very sensitive. Simple approximations can make the standard error appear 1.4 times smaller, which is enough to transform an insignificant result into a significant one. This is what is commonly known as “data dredging” or “p-hacking”: trying to find the appropriate set of assumptions under which your experiment has small standard error and is hence statistically significant.
The precise definitions of standard error and p-value don’t illuminate the situation. Since p-values lead you to pedantry and quibbling about tiny effects, their actual definition, which is complicated and hard to even explain to other statisticians, just confuses people and doesn’t fix science. Most practicing scientists would be better off not knowing what a p-value is.
And a lot of the other fixes also don’t help. For example, the fragility index is often used in medicine to describe how many “non-events” have to become events for the significance to vanish. But this is just a way to conflate sample size and p-values, and isn’t getting away from the core problem that statistical significance testing is a mass waste of time.
I am by no means the first person to complain about the absurdity of significance testing. Some examples from the last 50 years include Meehl (1978), Leamer (1983), Freedman (1991), Altman (1994), Kennedy (2002), Ioannidis (2005), Deaton (2009), Ziliak and McCloskey (2008), and Gelman (2016). The significance testing framework is barely 100 years old. And people have been rightfully attacking it for nearly as long. Why do we remain so stuck?
The aforementioned list of grumpy people have a deeper criticism of contemporary science beyond significance testing, and this critique is one I hope to take up in future blogs. When can we trust scientific consensus and what structures and methods are necessary to build valid scientific theories? Statistical validity is only a small part of the bigger picture that establishes the trustworthiness of a study. The study must be construct valid, measuring the right quantities. It must be internally valid, avoiding bias and confounding. And it must be externally valid, generalizable to other contexts. The next few blogs will try to unpack some thoughts on validity, and why validity and design remain the most pressing challenges in contemporary scientific inquiry.